


BluePes Blog: Insights & Trends


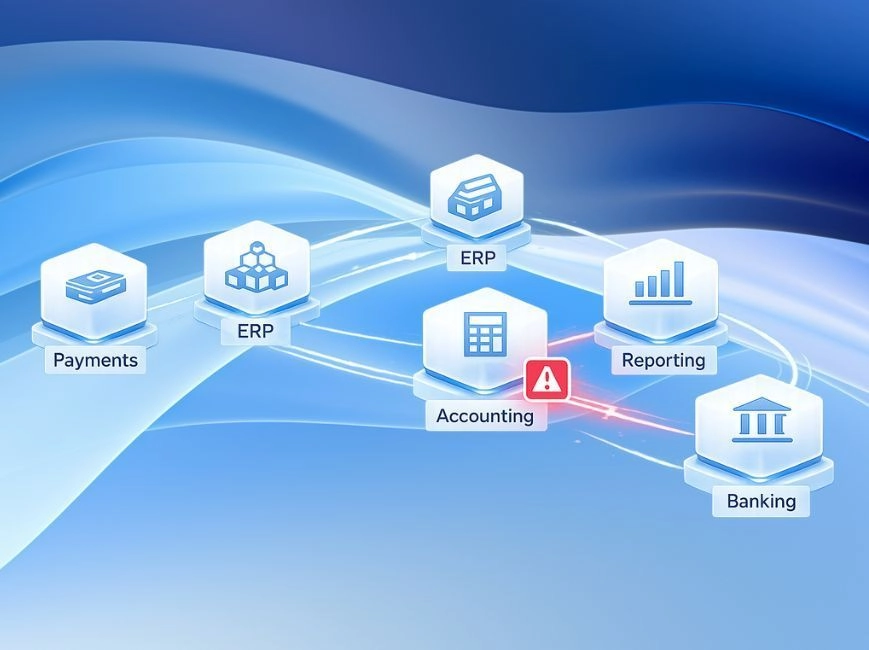
How financial data becomes inconsistent — and what structured integration solves
Financial systems rarely break in obvious ways. Payments are processed, accounting entries appear, data moves from one platform to another. The problem surfaces later — when finance teams prepare month-end reconciliations, quarterly reports, or audit packages and find that figures from the accounting platform, the payment provider, and the BI tool do not agree. This article is for CFOs, finance operations leads, and IT directors at mid-market companies who have connected multiple financial systems but still spend significant time reconciling data before each close. Next — a structured explanation of why inconsistencies happen and which integration approaches reduce them. Financial data inconsistencies are not random. They follow predictable patterns related to event timing, partial updates, and the absence of coordinated flow logic. Structured integration using a centralized iPaaS layer addresses these patterns directly and reduces the operational cost of managing finance data across systems.
- Feb 16, 2026
- 15 min


Integration observability: monitoring and traceability for enterprise flows
Most integration problems do not announce themselves with an error. APIs respond, scheduled jobs run, and dashboards show green. The first signal that something is wrong usually comes from a business analyst asking why two reports show different numbers, or from a logistics team wondering why an order that cleared payment three hours ago has not reached the warehouse system. This article is for IT Directors and Heads of Engineering at mid-market companies who manage multi-system environments and need to understand integration observability — what it is, how it differs from infrastructure monitoring, and what a practical implementation looks like when Boomi is used as the integration layer. If your team regularly discovers integration issues through reconciliation reports or user complaints rather than through tooling, this article covers why that happens and how to address it. Integration observability is the ability to understand whether end-to-end business processes complete reliably across systems — not just whether individual services are available. It requires visibility into flow execution, data movement, retry behavior, and processing time, at the level where integration logic actually runs. Without this visibility, teams operate on assumptions rather than evidence, and failures remain invisible until they surface as business consequences.
- Feb 09, 2026
- 15 min


How eCommerce Businesses Integrate ERP, Marketplaces, and Payments Without Breaking Under Scale
Most scaling problems in eCommerce don't appear on the storefront. Modern UI frameworks and SaaS tools absorb traffic growth without much friction. The real pressure accumulates behind the scenes, where orders, payments, inventory updates, and fulfillment statuses travel across four or five independent systems that were never designed to talk to each other. When eCommerce system integration is built without a long-term structure, the first sign is small: a manual check here, a reconciliation task there. Six months later, it's a recurring operational problem that surfaces every time you add a new marketplace or payment method. This article is for CTOs and engineering leads who manage eCommerce platforms where integration overhead is growing faster than the business itself. Below you will find a breakdown of where integrations typically fail, what architecture patterns address those failures, and how an iPaaS layer changes the maintenance equation. The short version: eCommerce data integration fails under scale not because of the individual systems, but because point-to-point connections between them multiply faster than teams can maintain them. A central integration layer — built around event-driven flows and a clear system-of-record model — resolves this. The platform choice matters less than the architecture decisions made early on.
- Feb 02, 2026
- 13 min

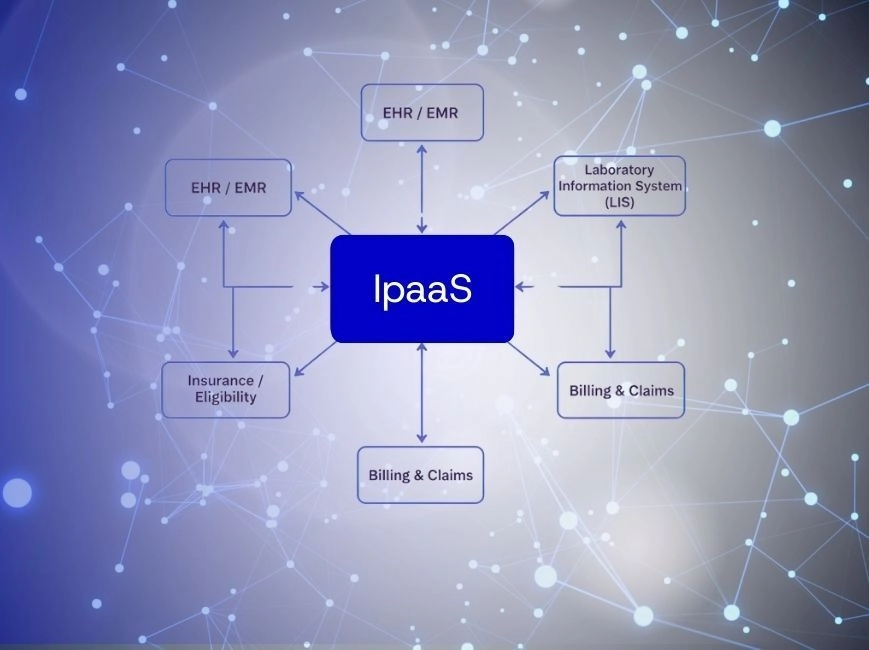
How to structure healthcare system integration across EHR, labs, billing, and analytics
Healthcare IT teams deal with one of the more unforgiving integration environments in enterprise software. Systems must stay connected around the clock, data failures carry real clinical and financial consequences, and the architecture that worked at 50,000 transactions a month often starts breaking silently at 500,000. This article is for CTOs, IT directors, and VP-level engineering leaders in healthcare organizations who are responsible for keeping EHR, lab, billing, and analytics systems aligned — especially when those systems were not designed to work together. The focus here is on architecture: what breaks, why it breaks, and how a centralized integration layer changes the outcome. Healthcare system integration — the structured exchange of data between clinical, operational, and analytical platforms — is not a one-time project. It is a continuous operational responsibility. The organizations that get it right invest in architecture before they need it, not after the first major incident. Bluepes is an independent software consulting company that works with Boomi and other integration technologies to help healthcare organizations build and maintain robust integration layers. Our healthcare integration projects have consistently shown that fragmentation is not the root problem — unmanaged fragmentation is.
- Jan 26, 2026
- 15 min



Predictable BI Costs Start in the Semantic Model Layer
Predictable BI costs come from controlling the semantic layer. The duplicated logic that makes two dashboards disagree is the same duplication that makes a platform refresh and store the same data several times over, and that repeated work is what lands on the bill. Aligning measures and models tends to steady the numbers and the spend at once.
- Jan 19, 2026
- 15 min



Resilient BI Systems: Recovering from Data Failures
A resilient BI system recovers from a failed or incomplete data load without silently publishing wrong numbers. It detects that something went wrong, holds or labels the last trustworthy state, and gives the team a clear path back to correct data. That property matters more in 2026 because pipelines pull from more asynchronous sources, and a single late feed can corrupt a metric several departments depend on.
- Jan 12, 2026
- 15 min



BI Team Alignment for 2026: BA, Engineering, and Business
The patterns are recognisable. Conflicting metrics show up across Finance and Operations dashboards. Refreshes miss windows because upstream owners changed without notice. Requests bounce between business analysts and data engineers through multiple sprints before anyone notices the scope shifted during the original intake. Each of these emerges whenever teams work alongside each other without explicit decision rights, clear intake rules, or durable handoff artifacts. As 2026 BI workloads grow, the cost of that ambiguity compounds.
- Jan 05, 2026
- 15 min



BI Readiness for 2026: Governance, Lineage, and Cost Control
BI readiness is the state of governance, lineage, refresh and capacity controls that determines how predictably reporting holds up as workloads grow. A team is ready when scaling adds dashboards without adding reconciliation calls. This article walks through the dimensions a BI lead can inspect this quarter, what “not ready” looks like in each one, and which gap to close first.
- Dec 29, 2025
- 16 min



Data quality rules every BI team should apply before 2026
Data quality rules close that gap. They define what every dataset is expected to contain, when it is allowed to update, which numeric values count as plausible, and how the system should respond when any of those expectations is violated. They are the reason the same KPI returns the same number across Finance, Operations, and the executive team on a Monday morning, even when the underlying systems have changed during the week.
- Dec 22, 2025
- 14 min