Ecommerce scalability and performance for peak season


Last season your platform held. The team breathed out, captured a few graphs, and moved on. Twelve months later, the stack is not the same platform you stress-tested in October. A new payment provider replaced the old one in March. The product catalog grew by forty percent after a B2B segment launched. The inventory service was rewritten to fix a sync bug. None of these were small changes individually, and together they form a different system entering peak season — a system whose ecommerce scalability and performance under burst load has not yet been verified against the actual stack the campaign will run on.
This is the part nobody talks about in the cloud-scaling articles. Auto-scaling does not save you when the bottleneck has moved to a synchronous call that did not exist last year. Preparing a seasonal platform is less about handling load in the abstract and more about knowing where this year's stack will fail under concentrated demand, and testing for that specifically.
The article walks through where seasonal platforms typically break, how to model peak traffic accurately during load testing, and how to design for scale-up and scale-down so you stop paying for January capacity in July.
Why seasonal traffic breaks platforms that handle year-round load fine
Seasonal e-commerce traffic differs from steady traffic in three ways that matter for architecture: it is concentrated, it is predictable in timing but not in shape, and the cost of failing under it is asymmetric in a way that pushes design choices in a specific direction. Each of these properties shapes a different trade-off the engineering team has to make, and each one is the reason a platform that ran fine last year may not run fine this year.
Concentration is the most obvious property and the most misunderstood. A platform handling one thousand orders per day across twenty-four hours sees roughly forty-two orders per hour. The same platform during a Black Friday promotion may handle eight thousand orders in the first ninety minutes, then taper across the day. That ten-times peak is not a scaling problem in the storage sense — capacity exists in the cloud — it is a problem of where the queues form, which services become synchronous bottlenecks, and which database tables suddenly contend for locks they never contended for in April.
Predictability cuts both ways. The team knows the campaign date, the discount, and the geographic markets being targeted. The team does not know how marketing will adjust copy in the final week, whether the email blast will hit at 09:00 or 09:15, or whether a TikTok creator the brand sponsored will publish six hours earlier than scheduled. The arrival shape — burst onset, slope, plateau, decay — is rarely the same across two peaks.
The cost asymmetry drives most of the architecture trade-offs. Over-provisioning capacity year-round to cover three months of peak is paying twelve months of bill for three months of value. Under-provisioning is paying nothing extra but absorbing a revenue event when checkout fails for an hour during the campaign's peak. The right architecture is one that scales up sharply and scales down completely, which is a more constrained design problem than scaling up alone. Mature e-commerce platform engineering solves this by separating components that need to grow elastically from components that can stay at baseline capacity.
AWS's Well-Architected Reliability Pillar puts this directly: the recommended pattern is to monitor demand and automate the addition and removal of resources to satisfy demand without over- or under-provisioning. The principle is clear; the difficulty is that on a real e-commerce stack the resources you need to add or remove are not always the ones the dashboards point to first.
Four places seasonal e-commerce platforms typically break
The failure modes below come up repeatedly across mid-market platforms entering their second or third peak season with a meaningfully changed stack. Each section covers what the failure looks like in production, the root cause, and how to test for it before the campaign begins.
Synchronous payment chains
The symptom in production: checkout latency rises from 800 ms to 6–8 seconds during the first thirty minutes of peak, then a fraction of orders fail with payment provider timeouts, and a smaller fraction succeed at the gateway but never reach the order service. Customer support starts receiving messages about charges with no order confirmation.
The root cause is almost always a synchronous call chain between checkout, fraud screening, payment authorization, and order persistence. Each link can be fast in isolation. Under burst load, the slowest link sets the latency floor for the whole chain, and the timeout configurations of each component compound — a five-second timeout at the gateway, a three-second timeout at fraud screening, and a four-second client-side timeout produce inconsistent outcomes when any one component is degraded. Worse, retries without idempotency keys produce duplicate authorizations.
The fix is structural: make the payment chain idempotent at every step, add a status-reconciliation job that runs every few minutes during peak to repair partial successes, and consider asynchronous order confirmation where the checkout completes the moment payment is authorized and the order document is created downstream. Test it by simulating not just high throughput but specifically the case where the payment provider returns p95 latency of three to four seconds — most providers degrade this way before they fail outright.
Inventory sync falling behind order velocity
Inventory drift during peak is the failure that produces the worst customer experience after the sale closes. The platform accepts an order, sends a confirmation, and only later discovers the SKU was out of stock in the warehouse system thirty seconds before the order was placed. The customer hears about it days later when fulfillment cancels.
This happens when the inventory service is updated through batch jobs or polling on an interval that worked fine at one order per minute and falls behind at one order per second. ERP-driven inventory updates are particularly prone to this — the ERP becomes a contention point, sync intervals lengthen under load, and the storefront keeps selling against stale numbers. This pattern is covered in depth in silent ERP integration failures, which catalogs how field ownership and sync model choices produce silent drift that only appears under load.
The architectural fix is to move inventory updates onto an event-driven path with a message queue between the order service and the inventory store, treat the ERP as the eventual consistency source rather than the live read source, and add a short-TTL reservation step at checkout so that adding a SKU to the cart locks one unit for a few minutes. The deeper trade-off between batch and streaming approaches — and when each fits — is treated in ETL vs real-time data pipeline trade-offs.
Testing for this requires simulating order velocity that exceeds the maximum write throughput of the current inventory sync. If the sync currently handles eight writes per second comfortably and peak generates twenty, the test must push past twenty to find the queue depth at which orders start being accepted against stock that no longer exists.
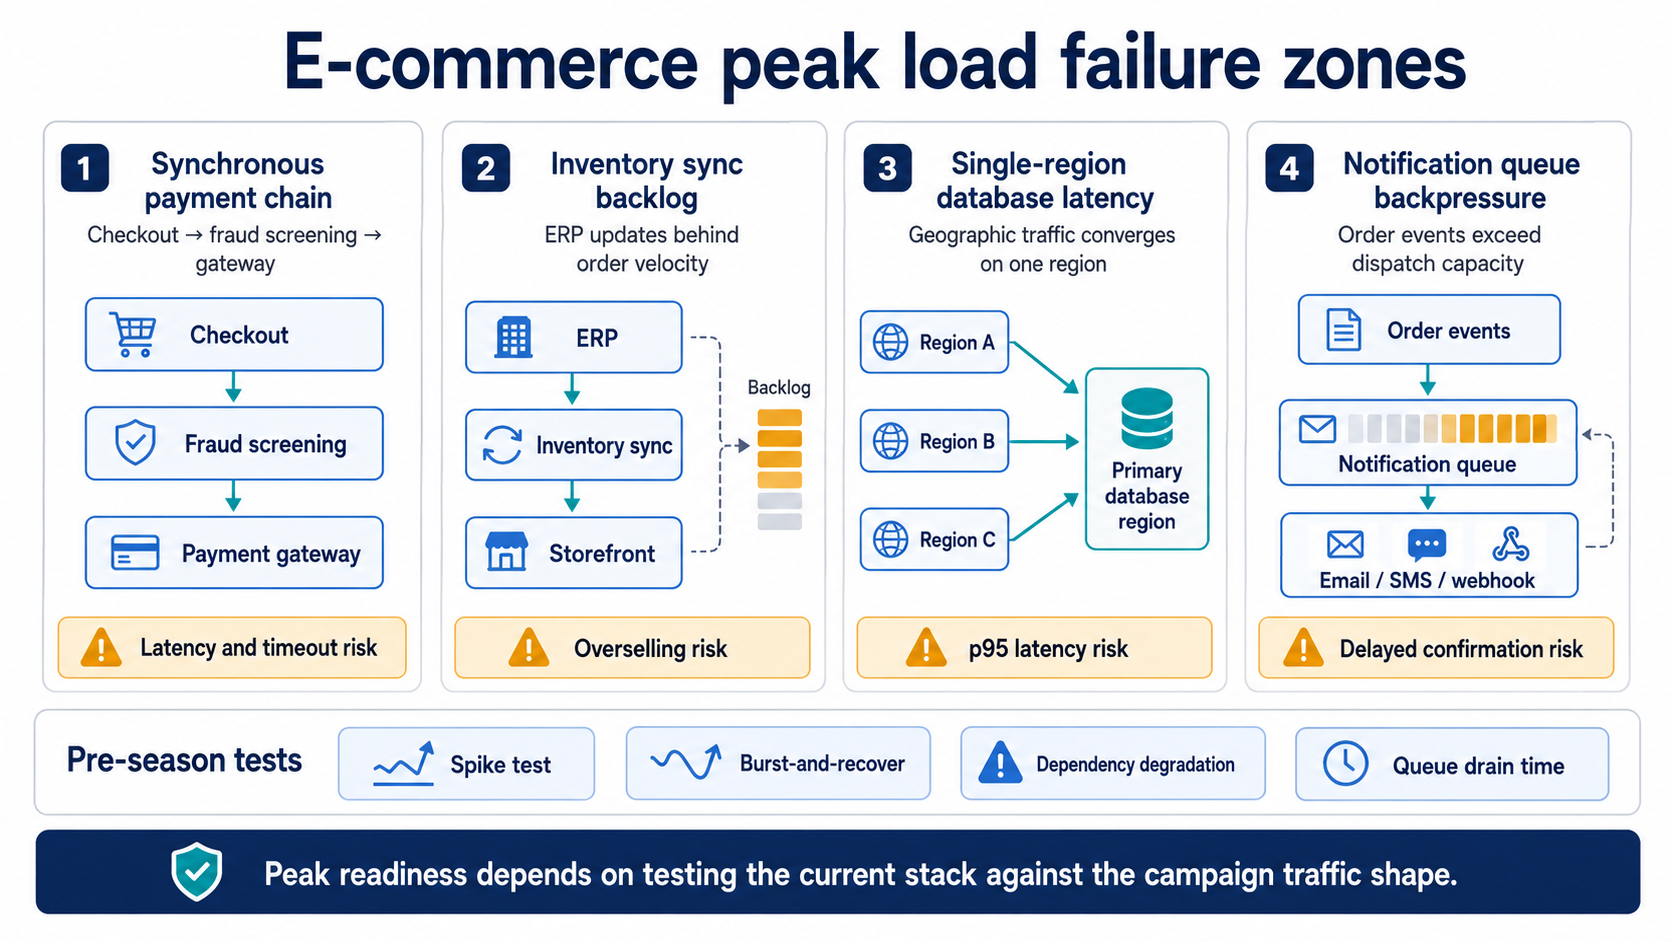
ecommerce-peak-load-failure-zones
Peak-season e-commerce failures usually form around payment latency, inventory sync backlog, regional database latency, and notification queue backpressure.
Single-region databases under geographic traffic concentration
If the campaign targets multiple countries and the primary database is hosted in one region, the concentration of traffic from the most distant geography becomes a quiet performance ceiling. Read queries from a region 150 ms away cannot be served faster than 150 ms plus query execution, no matter how aggressive the auto-scaling of the application tier is. During peak, the database itself may stay healthy by CPU and IOPS metrics, while p95 latency at the application layer rises because every page render waits on round trips.
This is not a failure in the strict sense — nothing crashes — but it shows up in conversion rates. Customers in distant regions abandon at higher rates during peak than during steady traffic. The pattern is hard to spot because the database dashboards look fine.
The mitigation is read replicas in the regions where peak traffic concentrates, aggressive CDN caching of catalog data so most page renders never touch the database, and an in-memory layer for pricing and inventory display that refreshes from the source on a short interval. Test it by routing synthetic traffic from the geographies the campaign will actually target, not just from the region where the engineering team sits.
Notification and confirmation queues backing up
Order confirmation emails delayed by ninety minutes during a Black Friday peak generate customer support volume that the team feels for a week. The same is true for SMS dispatch confirmations, push notifications to the customer mobile app, and webhook callbacks to fulfillment partners. The order completed cleanly; the customer experience around the order did not.
The cause is usually a queue between the order service and the notification dispatcher that processes messages serially or with a small worker pool sized for steady-state load. The queue depth grows linearly through the burst window and drains over hours after the burst ends. If the email provider rate-limits during the same window, the backup compounds. Designing the right monitoring around these queue depths — and treating queue lag as a first-class signal rather than an infrastructure metric — is the central topic in failure models and monitoring patterns.
The architectural fix is dynamic worker scaling on queue depth, partitioning the queue by notification type so transactional confirmations are not blocked behind marketing follow-ups, and pre-warming connections to the email and SMS providers before the campaign starts. Test it by injecting a burst that matches the peak hour's order rate and verifying queue drain time stays inside the SLA the business committed to.
If the engineering team is already working through what changed since last peak and needs a structured review of where this year's failure points sit, a working session with engineers who have run pre-season audits on seasonal marketplaces shortens that work. Review your seasonal architecture with our engineers.
Load testing that matches the actual shape of peak traffic
The most common mistake in pre-season load testing is using a steady throughput test as the proxy for a peak that arrives in a burst. A test that holds two thousand virtual users for thirty minutes tells the team the system can sustain two thousand concurrent users. It says nothing about whether the system survives a ramp from zero to two thousand in ninety seconds, which is closer to what happens when a marketing email lands and customers click through within the same minute.
Grafana's k6 documentation distinguishes spike testing — sudden and massive increases in traffic — from average-load and stress testing as a separate category of test that must be run when an event with concentrated traffic is expected. The shape matters because steady-throughput tests miss bottlenecks that only appear during ramp-up — connection pool exhaustion, cache stampedes, autoscaler reaction lag, and TLS handshake saturation at the load balancer.
A useful pre-season test plan includes three distinct test types run against the actual production-like environment with this year's stack, not last year's. The first is a spike test that simulates the campaign launch shape: a ninety-second ramp to peak, ten minutes at peak, gradual decay. The second is a burst-and-recover test that drops traffic to baseline mid-campaign and ramps again, to verify the autoscaler scales down without breaking warm caches. The third is a degradation test that runs at peak load while artificially slowing one downstream dependency — usually the payment provider — to see whether the rest of the system degrades gracefully or cascades.
Beyond the storefront, the test must exercise the components that are easy to forget: the payment provider sandbox at realistic latency, the inventory sync write path, the notification dispatch queues, and the webhook callbacks to fulfillment partners. A test that only loads the product listing and checkout endpoints leaves three of the four common failure zones unverified. The discipline of building this kind of test rig — and integrating it into the deployment pipeline so it runs against each pre-peak release — is part of the broader DevOps and load testing practices that mid-market e-commerce teams adopt before the second or third peak season.
Architectural patterns for ecommerce scalability and performance during peaks
The pattern that holds together across seasonal platforms is straightforward in description and demanding in implementation: design every hot path so that the work happens asynchronously after the immediate response to the customer, push read traffic to caches that can be invalidated cheaply, and trigger autoscaling on metrics that correlate with business load rather than infrastructure averages. The table below summarizes the four most useful patterns against the failure modes they prevent.
The autoscaler metric choice deserves a separate note. CPU-based scaling has a reaction delay measured in minutes — utilization climbs, scaler triggers, instance comes online, cache warms up, load balancer adds it to rotation. For a peak with a ninety-second ramp, this is too slow. Scaling on business metrics — orders per minute, queue depth, checkout-attempts — gives the system a leading signal rather than a lagging one. The autoscaler reacts when load is building, not after CPU is already saturated.
These patterns are not specific to any one cloud provider. The underlying cloud-native scaling patterns apply on AWS, Azure, and GCP equally — what differs is the specific service mapping and the cost optimization details when scaling down completely outside the season.
Seasonal marketplaces like Kortreistved — a Norwegian firewood platform whose demand concentrates in autumn and winter — illustrate the scale-down side of this. The architecture has to absorb the autumn ramp without crumbling and then operate efficiently across spring and summer when order volume is a fraction of peak. The platform structure described publicly on the project page (a Laravel and React stack with a location-based ordering system, supplier dashboards, and a supplier mobile app) shows the kind of component separation that allows different services to scale independently — the seasonal architecture pattern in practice, seasonal marketplace architecture.
The cross-team preparation problem
The most common cause of an unprepared peak season is not engineering — it is the gap between what marketing is planning and what engineering knows about. A campaign that engineering finds out about ten days before launch leaves no realistic window for load testing the actual stack, especially if vendor changes (a new payment provider, a new 3PL, a new fraud screening service) happened during the same quarter and were never load-tested at peak shape.
The pre-season checklist below forces the cross-functional alignment that prevents most of these gaps. It is not the engineering checklist alone — it covers marketing, operations, and finance touchpoints that change what engineering has to support.
- Marketing has committed to campaign dates, geographic targets, expected traffic multiplier vs. baseline, and email/SMS send windows at least eight weeks before the campaign.
- Engineering has a current inventory of changes to the stack since the last peak: new vendors, replaced services, schema migrations, library upgrades.
- Operations has confirmed the fulfillment partner SLAs and notification provider rate limits for the campaign window.
- Finance has approved a temporary capacity budget for the peak window, with explicit scale-down dates after the campaign.
- Engineering has run spike, burst-and-recover, and degradation tests against the actual production-like environment within four weeks of campaign launch.
Eight weeks is not a long lead time for a major peak; it is the minimum where engineering can meaningfully respond to new information. Where the lead time is shorter, the conversation shifts from 'can we prepare' to 'which risks must we accept this season and address before the next one.' That is a legitimate conversation when the alternative is delaying the campaign, and the worst version of it is when the conversation never happens explicitly.
When this level of preparation is unnecessary
Not every platform needs the full pre-season treatment. A clear-eyed view of when the preparation cost exceeds the failure cost is part of the design discipline.
If the catalog is small (a few hundred SKUs), the customer base is geographically concentrated in one region, and the peak is twice baseline rather than ten times baseline, most of the patterns described above are over-engineering. A modestly over-provisioned single-region setup with reasonable caching will hold, and the cost of the preparation exceeds the cost of a one-hour degradation event.
The threshold to take seriously: when the revenue at risk during one hour of peak exceeds the cost of three months of engineering time spent preparing, the preparation is the rational choice. When that ratio inverts, simpler is better. Mid-market platforms typically cross the threshold during their second or third peak season, often after the first peak where they observed unexpected failure modes and decided not to repeat the experience.
Key takeaways
- Seasonal e-commerce traffic is architecturally different from steady traffic — concentrated, predictable in timing but not in shape, and asymmetric in cost-of-failure.
- Four predictable failure zones recur across mid-market seasonal platforms: synchronous payment chains, inventory sync behind order velocity, single-region databases under geographic concentration, and notification queues backing up.
- Steady-throughput load tests miss the failure modes that only appear during burst ramp-up; spike, burst-and-recover, and degradation tests catch them.
- Auto-scaling on business metrics like orders per minute reacts to load building, while CPU-based scaling reacts after saturation is already happening.
- The most common cause of an unprepared peak is the gap between marketing planning and engineering visibility — an eight-week lead time is the minimum for meaningful pre-season work.
Why pre-season architecture review beats post-incident response
Last season's performance is a snapshot of last season's stack under last season's traffic. The platform that handled the previous peak gracefully is not the same platform entering this one. The point of pre-season architecture review is not to guarantee zero degradation — that bar is unrealistic — it is to convert the unknowns into known trade-offs the business can decide on with eyes open.
The teams that handle peak season well are not the ones with the largest cloud bills or the most sophisticated autoscalers. They are the ones who know what changed since the last peak, who tested the new shape of the stack against the shape of the campaign traffic, and who scaled down completely once the season ended. The work is structured, the questions are answerable, and the conversation across engineering, marketing, and operations happens before the campaign, not during it.
If your team is preparing for the next peak and the stack looks meaningfully different from last year, a working session with engineers experienced in seasonal marketplace architecture clarifies which of the failure modes apply to your platform and which do not. Plan a pre-season architecture review with our team and walk away with a concrete test plan and timeline.
FAQ


Interesting For You


E-commerce RFP technical questions vendors must answer
This article gives eight questions worth adding to an e-commerce development RFP and explains what a strong answer, a weak answer, and a direct Bluepes-style answer should look like.
Read article


Supplier mobile app for marketplaces: a decision guide
For marketplace teams with a functioning supplier dashboard, the next decision is whether to extend it with a mobile experience and what shape that mobile product should take. The reader of this piece already has operational evidence on where vendors fall out of the flow. The question is whether a supplier mobile app for marketplaces is worth the engineering investment, and which architectural decisions matter most if the answer is yes.
Read article


Marketplace plugin vs purpose-built platform: when to move
Marketplace plugin vs purpose-built platform is not a feature comparison. A plugin is an adapter over someone else's commerce architecture. At low volume the adapter holds. As the operating model grows — multi-jurisdiction payouts, custom routing, per-vendor pricing and inventory variation — the gap between what the plugin allows and what the business needs widens into operational cost. At that point the architecture decides the next eighteen months of the business, not the feature roadmap.
Read article