Integration observability: monitoring and traceability for enterprise flows


Most integration problems do not announce themselves with an error. APIs respond, scheduled jobs run, and dashboards show green. The first signal that something is wrong usually comes from a business analyst asking why two reports show different numbers, or from a logistics team wondering why an order that cleared payment three hours ago has not reached the warehouse system. This article is for IT Directors and Heads of Engineering at mid-market companies who manage multi-system environments and need to understand integration observability — what it is, how it differs from infrastructure monitoring, and what a practical implementation looks like when Boomi is used as the integration layer. If your team regularly discovers integration issues through reconciliation reports or user complaints rather than through tooling, this article covers why that happens and how to address it. Integration observability is the ability to understand whether end-to-end business processes complete reliably across systems — not just whether individual services are available. It requires visibility into flow execution, data movement, retry behavior, and processing time, at the level where integration logic actually runs. Without this visibility, teams operate on assumptions rather than evidence, and failures remain invisible until they surface as business consequences.
Updated in April 2026
Why integration failures stay invisible for so long
Integration failures are frequently partial rather than absolute. A flow may start correctly, process several steps, and then stall or retry silently later in the sequence. When the retry eventually succeeds, the technical system logs nothing unusual. But the delay — which might be minutes or hours — has already affected downstream processes.
Three patterns appear most often in mid-market environments where integration has grown incrementally over several years:
- Orders reaching ERP systems hours after payment confirmation, causing fulfillment delays that neither the warehouse team nor the integration system flagged proactively.
- Inventory updates that complete for one sales channel but silently fail for another, producing stock discrepancies that only surface during manual reconciliation.
- Analytics pipelines receiving corrected data long after reports have already been distributed — so the correction never reaches the stakeholders who acted on the original numbers.
From an infrastructure perspective, none of these situations look like failures. Services are running. Queues are moving. The integration platform reports no critical errors. From an operational perspective, however, these patterns erode trust in data, create recurring manual work, and slow down decision-making.
According to the CNCF Observability Survey 2023, lack of observability across distributed systems is among the top factors contributing to prolonged incident resolution. In integration-heavy environments, this is not a tooling problem — it is an architectural one. Traditional alerting is built to catch explicit errors, not to track whether a business process completed end-to-end.
How integration observability differs from infrastructure monitoring
The distinction matters practically. Infrastructure monitoring answers whether systems are operational: are APIs responding, are queues processing, are services healthy. These signals are necessary, but they describe the environment, not what happens inside the integration flow.
Integration observability operates at a different level. It answers whether a specific business process completed, which step in the flow consumed the most time, which data objects were affected by a retry, and where the bottleneck sits when processing slows down. The OpenTelemetry observability primer describes this principle as the ability to ask arbitrary new questions about system behavior from outside the system — without requiring code changes or log analysis to get an answer.
Monitoring vs observability: key differences at the integration layer
The practical consequence is this: a team that monitors only infrastructure can have 100% service uptime and still have integration flows that consistently fail to deliver data on time. Observability at the flow level is what closes that gap.
If your team regularly discovers data discrepancies through reconciliation reports or user complaints, there is a good chance that integration observability is missing at the flow level. Teams that have already mapped their integration architecture get the most out of an early review — it surfaces gaps before they become recurring problems. Discuss your integration setup with our team.
Common degradation patterns in growing integration landscapes
As organizations add systems, regions, and partners, integration complexity grows faster than transaction volume. Without flow-level visibility, this expansion tends to introduce patterns that are individually small but collectively significant.
Delayed propagation
Data moves correctly but arrives too late to support downstream processes. The delay is usually not constant — it varies by load, retry behavior, and system availability — which makes it harder to detect through static thresholds. The symptom is reports being generated with data that is hours old, or fulfillment systems acting on information that has already changed.
Partial completion
A flow updates some systems and silently does not reach others. This pattern is particularly common when an integration spans systems with different availability characteristics — a cloud API and an on-premise system on the same flow, for example. The cloud side reports success while the on-premise update is pending or failed.
Hidden retries
Automatic retry mechanisms are designed to handle transient failures. When retries become frequent, they mask underlying instability and shift failures in time rather than resolving them. A flow that retries three times before succeeding looks like a success in the logs but indicates a reliability problem that will eventually worsen.
State inconsistency
Different systems reflect different versions of the same business event. A customer record that shows one status in CRM, another in ERP, and a third in the support platform is the operational result of flows that completed partially or in the wrong sequence. Resolving these inconsistencies manually is time-consuming and does not address the root cause.
These patterns tend to normalize over time. Teams begin to treat them as expected behavior, building workarounds that compound the underlying problem. For a deeper look at how process-level visibility relates to these patterns, see process-level observability in integration systems.

integration-degradation-patterns-diagram
Common integration degradation patterns include delayed data propagation, partial updates, hidden retries, and inconsistent system states.
Using Boomi as the observability layer for enterprise integration
Integration observability is most effective when it is implemented at the layer where flows actually execute. This is one of the practical reasons organizations working with Boomi as their iPaaS platform use it as the central observability layer — not just the execution engine.
Bluepes is an independent integration consulting company. We work with Boomi as a platform and help clients implement integration architectures that include monitoring, traceability, and operational control from the start. The observations below reflect what we have seen work in practice, not a product endorsement.
When integration logic runs centrally through an iPaaS layer, teams gain the ability to observe:
- when a flow started and when it completed — or where it stopped
- which specific steps failed, retried, or timed out
- how long each step took, and how that compares to baseline
- which data objects were affected by a failure or retry
- whether a business process reached its intended endpoint
This shifts observability from system-specific logs — which require access to multiple platforms to correlate — to a single flow-centric view that maps directly to how the business defines the process. Boomi's built-in monitoring capabilities, documented in Boomi Integration Management, provide the foundation for this approach. The practical value depends on how consistently that foundation is applied across flows.
For teams working with Boomi integration services, we recommend treating the monitoring configuration as part of the integration design, not a post-deployment step. Flows that include defined error handling, named process steps, and explicit completion signals are significantly easier to observe and debug than flows that rely on default behavior.
What integration observability actually requires in practice
Observability becomes useful only when teams agree on what signals matter for their specific business context. The signals that matter at the integration level fall into two categories: technical signals that describe how flows execute, and business signals that describe whether processes complete as intended.
Flow-level signals
Flow-level observability signals and their operational value
Business-level signals
Technical signals describe execution behavior. Business-level signals describe outcomes. The distinction is important because a flow can complete technically — no errors, no retries — and still fail to deliver the right data at the right time to the right system.
Business-level signals include: whether an order reached the fulfillment system within the expected window, whether an inventory update reflected in all downstream platforms before the next batch, and whether a customer record is consistent across CRM and support systems after an update. These signals require defining what "success" means for each integration flow in business terms, not just technical ones.
Scaling integrations without losing operational control
Observability requirements change as integration landscapes grow. A team managing ten flows can often get by with manual log review and periodic reconciliation. A team managing a hundred flows across multiple environments, time zones, and partner systems cannot.
The patterns we see in organizations that scale integration successfully tend to share three characteristics. First, observability is treated as a design requirement, not a monitoring add-on. Flows are built with named steps, explicit error handling, and defined completion criteria from the start. Second, a centralized integration layer handles flow execution and provides a single source for monitoring data, rather than distributing that responsibility across individual system integrations. Third, the team managing integration has dedicated engineering capacity — not just the developers who built the flows originally.
For organizations that need to scale integration engineering without building a large internal team, working with dedicated development teams focused on integration ensures that observability practices evolve alongside the integration architecture rather than lagging behind it.
For technical detail on how Boomi handles high-volume scenarios specifically, see scaling high-load integrations in Boomi, which covers Molecules, runtime optimization, and monitoring under load.
Designing observability into integration architecture
The most durable observability setups are not retrofitted — they are designed in from the beginning. This requires making decisions about architecture that go beyond the functional requirements of the integration itself.
At the flow level, this means using consistent naming conventions for processes and steps, standardizing error handling across flows so that failure data has the same structure regardless of which system is involved, and defining explicit ownership — who is responsible for investigating when a specific flow fails or degrades.
At the architecture level, this means deciding early whether flows will be monitored centrally or per-system, what the alerting thresholds are for retry rates and processing time, and how long execution logs need to be retained for compliance and audit purposes. These are operational decisions that belong in the integration design phase, not the post-go-live phase.
The principle articulated in the OpenTelemetry documentation — that observability should allow teams to ask new questions about system behavior without redeploying code — applies directly here. Flows that are designed with observability in mind can answer questions about data movement and process completion that arise months after initial deployment, without requiring anyone to modify the integration logic.
Key takeaways
- Integration observability focuses on whether business processes complete end-to-end — it addresses a gap that infrastructure monitoring does not cover.
- The most common integration problems in mid-market environments are partial completions, delayed propagation, hidden retries, and state inconsistency — none of which trigger standard infrastructure alerts.
- iPaaS platforms like Boomi provide the foundation for integration observability when monitoring is treated as part of the integration design, not a post-deployment addition.
- Flow-level signals (completion status, retry count, step duration, error context) and business-level signals (order delivery time, record consistency) both need to be defined for observability to be operational.
- Observability designed into integration architecture from the start scales more reliably than monitoring retrofitted onto existing flows.
Conclusion
Integration environments grow gradually, and so does the operational risk that comes with limited visibility. Teams that discover integration problems through reconciliation reports, customer feedback, or analyst queries are working reactively — the failure has already had a business impact by the time it surfaces.
Adding observability at the integration layer does not require rebuilding existing flows. It requires treating monitoring as a design requirement, defining what completion means for each business process, and ensuring that the integration platform provides the signals needed to answer operational questions without manual investigation.
If your team is already experiencing the patterns described in this article — delayed data, inconsistent records, manual reconciliation as a routine task — reviewing the observability design of your integration architecture is a practical first step. Our integration team works with organizations at this stage to map existing flows, identify visibility gaps, and put monitoring in place before issues become recurring. Contact us to discuss your integration setup.
Boomi is a trademark of Boomi, LP. Bluepes is an independent software consulting company. We are not affiliated with, endorsed by, or certified by Boomi, LP.
FAQ


Interesting For You


How eCommerce Businesses Integrate ERP, Marketplaces, and Payments Without Breaking Under Scale
Most scaling problems in eCommerce don't appear on the storefront. Modern UI frameworks and SaaS tools absorb traffic growth without much friction. The real pressure accumulates behind the scenes, where orders, payments, inventory updates, and fulfillment statuses travel across four or five independent systems that were never designed to talk to each other. When eCommerce system integration is built without a long-term structure, the first sign is small: a manual check here, a reconciliation task there. Six months later, it's a recurring operational problem that surfaces every time you add a new marketplace or payment method. This article is for CTOs and engineering leads who manage eCommerce platforms where integration overhead is growing faster than the business itself. Below you will find a breakdown of where integrations typically fail, what architecture patterns address those failures, and how an iPaaS layer changes the maintenance equation. The short version: eCommerce data integration fails under scale not because of the individual systems, but because point-to-point connections between them multiply faster than teams can maintain them. A central integration layer — built around event-driven flows and a clear system-of-record model — resolves this. The platform choice matters less than the architecture decisions made early on.
Read article


How to scale Boomi integrations under high load: Molecules, tuning, and monitoring
Queue buildup is usually the first warning. Processes that completed in seconds start taking minutes, retry counts climb, and the operations team begins investigating what looks like a connector issue — but the actual cause is a single-node runtime that was not built for this volume. Bluepes is an independent software and integration consulting company that works with Boomi on client projects across healthcare integration projects and fintech environments. This article is for CTOs and engineering managers who already run Boomi and are starting to see performance pressure under growing load. Next — a structured explanation of how Molecule architecture addresses this, which parameters to tune, and how to build monitoring that catches degradation early. Boomi provides three tools for managing high-load scenarios: Molecules for horizontal runtime scaling, performance tuning for thread and JVM configuration, and process-level monitoring for operational visibility. Used together, they let organizations grow integration volume without the brittleness of a single-node deployment.
Read article

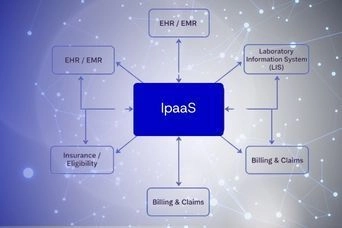
How to structure healthcare system integration across EHR, labs, billing, and analytics
Healthcare IT teams deal with one of the more unforgiving integration environments in enterprise software. Systems must stay connected around the clock, data failures carry real clinical and financial consequences, and the architecture that worked at 50,000 transactions a month often starts breaking silently at 500,000. This article is for CTOs, IT directors, and VP-level engineering leaders in healthcare organizations who are responsible for keeping EHR, lab, billing, and analytics systems aligned — especially when those systems were not designed to work together. The focus here is on architecture: what breaks, why it breaks, and how a centralized integration layer changes the outcome. Healthcare system integration — the structured exchange of data between clinical, operational, and analytical platforms — is not a one-time project. It is a continuous operational responsibility. The organizations that get it right invest in architecture before they need it, not after the first major incident. Bluepes is an independent software consulting company that works with Boomi and other integration technologies to help healthcare organizations build and maintain robust integration layers. Our healthcare integration projects have consistently shown that fragmentation is not the root problem — unmanaged fragmentation is.
Read article