KPI misalignment across teams: the structural causes


A leadership review opens, the revenue slide goes up, and within two minutes Finance and Product are arguing about which figure is correct. Both numbers came from real systems, and both are defensible. The meeting spends its first quarter-hour reconciling instead of deciding, and that ritual repeats every cycle. This is KPI misalignment, and it almost never starts as a broken dashboard.
KPI misalignment is the condition where the same metric carries different definitions across teams, so each one produces a defensible but different value. The cause usually sits in how metrics were introduced, defined, and copied across systems over time. The conflict only becomes visible — and expensive — when those numbers meet in a shared decision.
What follows isolates the diagnosis: how one KPI quietly splits into several, why the data layer is usually not at fault, and a short test for whether your organisation already runs on multiple versions of the truth. The repair work — definitions, ownership, propagation — gets pointers to where that detail lives.
Updated in June, 2026
How one KPI quietly becomes several metrics
A single KPI turns into several metrics when each team defines it for its own context and no one reconciles those definitions afterward. Most companies never set metric definitions up front; they appear as needs arise. Finance wants revenue visibility for the close, Operations tracks throughput, Product measures engagement. Each definition is reasonable inside the team that built it.
The drift shows up in the calculation, not the name. Revenue can mean invoiced amounts in one report and recognised income in another. Active users can be counted from login events in Product and from account status in Finance. Completion rates can be measured at different stages of the same workflow. None of these is wrong on its own; they collide only when they are quoted interchangeably in a forecast or a board pack.
The clearest example comes from finance, where invoiced revenue and recognised revenue answer different questions and both are legitimate. The split is sharpest in finance and banking platforms, where recognition rules are formal and the reported figure feeds external commitments. That collision is where reporting shifts from describing the business to steering it: a definition built for an operational dashboard ends up underwriting a revenue commitment, and the gap between the two becomes a credibility problem rather than a footnote.
Why the data pipeline is rarely the cause
In most environments the pipelines are doing their job. Events arrive, records sync, APIs return what they should. The divergence appears after the data lands, in the layer where business logic gets applied — and that logic tends to live in several places at once.
A single KPI can be shaped in any of these, often simultaneously:
- SQL written for a specific report, with its own filters and joins
- transformation logic inside the BI tool or semantic model
- spreadsheet calculations maintained outside any system of record
- rules embedded in integration or ETL flows upstream
Each layer adds an interpretation. When the same metric is defined in four places, consistency depends on people remembering to keep four definitions identical — through staff changes, reorganisations, and quarter-end pressure. That holds for a while in a small team, then breaks with growth, because the number of places a definition can drift grows faster than anyone’s ability to police them.
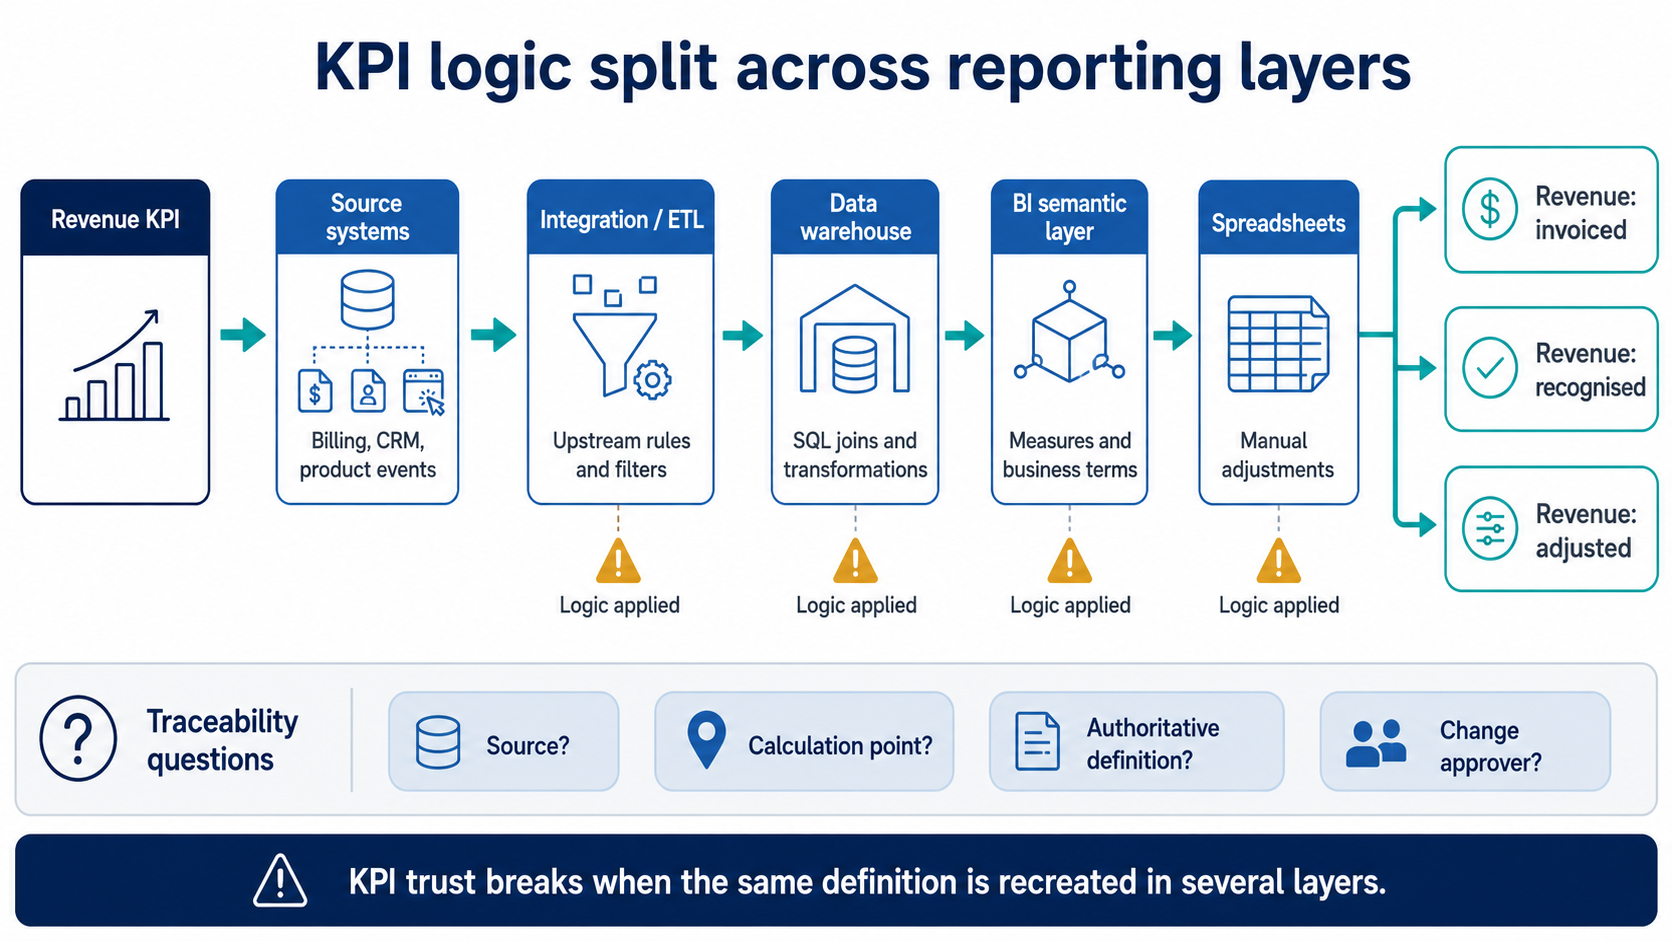
kpi-misalignment-logic-split-map
KPI misalignment usually appears after data lands, when the same metric logic is recreated in SQL, semantic models, spreadsheets, or ETL flows.
If reconciliation has become a standing item before every leadership meeting, the cheapest first move is mapping where each leadership KPI is actually calculated — not rebuilding the stack. Our data and analytics consulting team runs this trace as a scoped review, so you can see the duplication points before deciding what to change. Talk through your current setup and we'll outline what a metric audit looks like for your stack.
Where trust in the numbers starts to break
Trust erodes on a predictable schedule. Reporting takes longer to prepare, because someone has to reconcile sources by hand before anything is shared. Checks that were occasional become routine. Eventually leadership meetings open by validating the numbers rather than acting on them, and a report’s credibility starts to depend on who assembled it.
The downstream effects are organisational, not technical. Teams hedge on targets they cannot defend with a single agreed figure. Forecasts carry padding against numbers no one fully trusts. Two managers present the same KPI with different values and spend the meeting defending methodology. This is a governance gap that happens to surface in dashboards, and tooling alone will not close it, because what is missing is an owner and an agreed definition that a feature cannot supply.
A test you can run: KPI traceability
You can diagnose this in an afternoon with one question per metric: is it traceable? For every leadership-level KPI, four answers should be quick and unanimous across teams.
The four questions
- which system holds the source data
- where the calculation logic is applied
- which definition is the authoritative one
- who approves a change to it
If those answers vary depending on whom you ask, the metric already exists in more than one version, regardless of how clean the dashboards look. Traceability is the property worth measuring, because it predicts whether two teams will agree before they are in the room.
The same handful of metrics tend to fracture in the same way across industries. The symptoms differ; the structure repeats.
What actually closes the gap — and where to go deeper
The structural fix is narrow to state and substantial to implement: each metric gets one owned definition, stored where it can be reused, and propagated to every report instead of recopied. In a modern stack that authoritative definition usually lives in a semantic layer. A Power BI semantic model is exactly this kind of logical layer, holding metrics and business terminology for downstream analysis. Tools such as dbt’s MetricFlow and Semantic Layer make the same point from the transformation side: define a metric once and serve consistent results to every consumer, rather than duplicating the calculation per report.
Naming the layer is the easy half. Making it stick is governance work — written definitions, a named owner per KPI, data contracts at boundaries, lineage, and a change process that propagates updates instead of leaving stale copies behind. That implementation is its own subject; the practical patterns, including a staged rollout, are covered in lightweight data governance for BI. The coordination side — keeping business analysts, engineering, and stakeholders working from the same definitions as workloads grow — is treated in aligning BA, engineering, and business teams. For teams standardising metric logic inside the reporting platform itself, Power BI semantic model and KPI governance is where that work usually sits.
None of this is unconditional. Legacy systems limit where logic can be centralised, and some metrics genuinely need context-specific variants — a marketing-qualified lead and a sales-qualified lead are not the same thing and should not be forced into one number. Alignment efforts also stall without executive backing, because choosing the authoritative version of a contested figure is a decision about authority as much as arithmetic. The aim is a defensible single definition where one belongs, not uniformity for its own sake.
Key takeaways
- KPI misalignment usually begins when teams define a metric ad hoc for their own context, not when a pipeline fails.
- The same metric name can carry different calculations — invoiced versus recognised revenue, event versus account-based users — that conflict only in shared decisions.
- Divergence almost always lives in the logic applied after data lands: SQL, BI transformations, spreadsheets, and integration rules.
- A metric is traceable when you can name its source, its calculation point, its authoritative definition, and its change approver — and every team gives the same answers.
- The durable fix is one owned definition per metric propagated from a single semantic layer, which is governance work rather than a tool purchase.
Why tracing one KPI beats another reconciliation cycle
The instinct when numbers disagree is to buy a better dashboard or rebuild a pipeline. Neither addresses the cause, because the conflict was created by definitions multiplying across layers, and it persists until those definitions are traced, owned, and reduced to one authoritative version per metric. Start with the metrics that drive decisions, run the traceability test, and you will usually find the duplication concentrated in a handful of places you can fix deliberately.
If leadership reviews in your organisation keep opening with a debate about whose number is right, map your KPI definitions and ownership with our team, and we will trace each leadership metric back to its source before recommending what to change.
FAQ


Interesting For You


Why Agentic AI in the Enterprise Depends on the Integration Layer
Most enterprise AI projects do not fail because the models are inadequate. They fail because the data feeding those models is inconsistent, delayed, or simply unreachable. According to a 2025 analysis, why AI agent pilots fail in production comes down to one recurring problem: the absence of a structured integration layer between AI systems and enterprise data. This article is for CTOs and VPs of Engineering who are evaluating how to introduce AI agents into existing enterprise infrastructure. It addresses what integration architecture those agents actually require to work reliably — and where Boomi fits into that picture. The short answer: agentic AI needs a stable, governed integration layer to access enterprise data, trigger downstream processes, and log every action taken. Without that layer, agents either operate on incomplete information or become impossible to audit and explain.
Read article


How financial data becomes inconsistent — and what structured integration solves
Financial systems rarely break in obvious ways. Payments are processed, accounting entries appear, data moves from one platform to another. The problem surfaces later — when finance teams prepare month-end reconciliations, quarterly reports, or audit packages and find that figures from the accounting platform, the payment provider, and the BI tool do not agree. This article is for CFOs, finance operations leads, and IT directors at mid-market companies who have connected multiple financial systems but still spend significant time reconciling data before each close. Next — a structured explanation of why inconsistencies happen and which integration approaches reduce them. Financial data inconsistencies are not random. They follow predictable patterns related to event timing, partial updates, and the absence of coordinated flow logic. Structured integration using a centralized iPaaS layer addresses these patterns directly and reduces the operational cost of managing finance data across systems.
Read article


Introduction to Data Science: Resources Available Online
Data Science is a highly developing field, with a steady upslope of demand for data scientists. Job openings for data scientists have increased by 56% over the past year, according to LinkedIn. There are more and more people who want to start their career in Data Science, or plan to use some Data Science techniques in their work. An important question emerges for the people following this route: “Where can I start learning Data Science?” There is no simple answer to this question. Data Science is a complex multi-disciplinary field. It employs techniques and theories from statistics, multivariable calculus, linear algebra, and Machine Learning. Data scientists need good knowledge in the fields mentioned above, as well as strong programming and data visualization skills. There are many offline and online university programs for those who want to gain a degree in Data Science. In this article, we will consider the case of a person who already has enough background in math, statistics, and programming, and focus on online resources specifically for Data Science. The basic concepts and techniques of Data Science can be learned in different ways, but, in general, it is better to use a resource that gives a complete picture of the subject, such as MOOCS. E-books are also very useful in understanding the basic concepts of Data Science. Usually, books open the subject deeper, but less widely than MOOCS. So, in my opinion, the best way to start is to find a MOOC or e-book that corresponds to your skill level (according to the requirement skills for Data Science mentioned above). For your reference, we have listed below some MOOC platforms, courses and e-books that can be helpful for beginners. MOOCS:
Read article